Not doing code reviews? NDepend can help you
3rd Aug 2014
In a previous post about NDepend, I looked at how it can be used to clean up codebases by easily and quickly isolating blocks of code or classes that violate a set of rules. Helpfully, NDepend ships with a sensible set of default rules, so if we like we can stick to NDepend's defaults, or tweak them or add our own as we see fit.
Having just finished off a sprint with a fairly large team, I decided to install the NDepend 5 Visual Studio 2013 extension and do some digging around the solution. Whilst the information that NDepend 5 has shown to me has been a little depressing, it's also compulsive reading and does break out the "engineer" within you, as you find yourself questioning the point of classes or methods, and thinking how you could better refactor NDepend code violations. It's a great exercise to pair up with another Dev on your team and run through the code violations together - I found I could bounce code refactoring ideas off of a colleague in my team. NDepend could even be used here to help run code reviews as many of it's out of the box rules follow the the SOLID principles, and not some member in your team's opinion.
NDepend 5... What's new?
Once you've installed NDepend, get ready to let it lose on your codebase. Brace yourself for the results - remember, it isn't personal...
Dashboards, Dashboards, Dashboards
Dashboards add a huge value to any application (I know because I have built a few), and what can be particularly valuable is a set of visual indicators that quickly summarise some metric. Aside from NDepend's Red / Green light that appears in the bottom right of Visual Studio (which is a very high level indicator of the state of your codebase and is a nagging reminder that you've got some critical code violations to sort out), the dashboard gives you a more detailed information. You can get to the dashboard by clicking on NDepend's indicator icon, or by selecting "Dashboard" from the window that is shown after NDepend has had a good old inspection of your codebase.
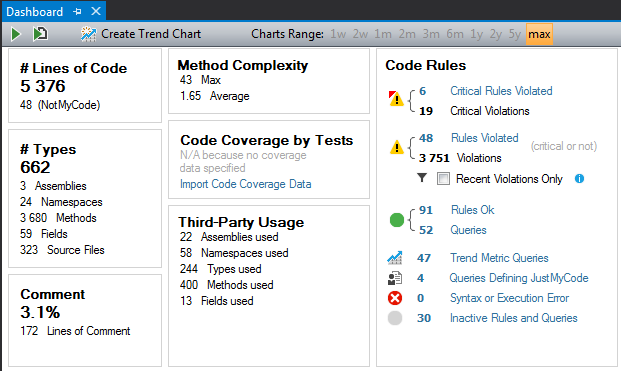
The top half of the new Dashboard shows you some cool high level stats about the dll's that you just analysed. If you are feeling brave, you could even share some of these stats with the project sponsors, but naturally only after you've got your code coverage up. The dashboard also shows you the current state of codebase against NDepend's code rules, and any custom rules that you may have added, with the most critical violations shown at the top.
Analyse regularly to get the most out of NDepend 5
Before I continue looking into the new features of NDepend 5, it's worth noting one of the key things that you need to do in order to unlock the full power of NDepend. Each time you analyse your codebase, NDepend captures information about the current state of it. This capture is a timecapsule to how it looked, and can be used as a "baseline" for comparative analysis. The more you analyse, the more baselines you will have.
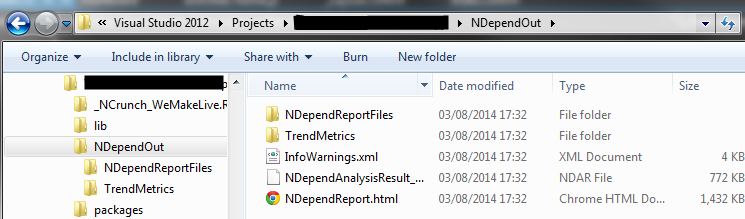
By default, the data gathered from each analysis is stored in an "NDependOut" folder that lives at the same level as your solution file. I would recommend committing this folder to source control so that other members of your team can make use of these files, and so that they are treated with the same importance as your actual codebase.
Is my team getting better or worse at writing code?
A new addition to NDepend 5 is the ability to restrict code analysis to recent code only. This will help you to hide the noise and focus on the code that your team is writing right now. On a codebase that has got a few years behind it, and is of a significant size, it would be a little unrealistic to refactor all of the older code. Even if you are using other coding standards add-ins such as Style Cop, it's easy to get lost in a sea of broken rules when you are looking at a codebase that has existed for several years.
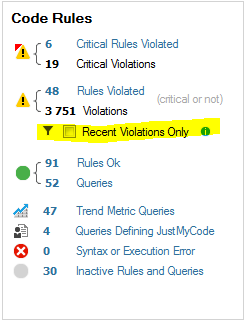
In order to define what your recent code actually is, you will need to provide NDepend with a "baseline", if it cannot find the data on its own. This will tell NDepend about the state of the code at a previous time. The state of the codebase will be captured by NDepend every time you press the big "Analyse" button, so remember, the more you analyse, the more data you will have. You will be prompted for this information, if needed, when you check the "Recent Violations Only" checkbox.
In my case, I found that it was best to analyse the codebase at the start of a sprint, and then again as the sprint approached its final days, in order for there to be enough time for the team to do any refactoring that we felt was necessary on any code written during the sprint.
You could even analyse after each feature request or bug was closed off in order to get more finely grained data.
Is the new code that is being written of a good standard?
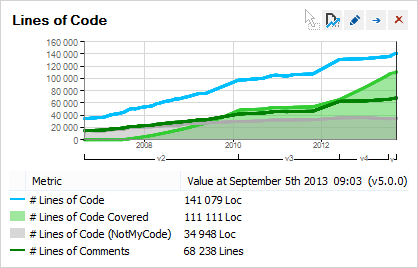
As the baselines offer an insight into the state of the code, NDepend 5 comes bundled with a set of graphs that detail how your codebase is performing between analyses. The default graphs will give you an insight into the how your codebase is changing in terms of the number of lines of code (I personally enjoy simplifying and deleting code, so this metric is quite an important one for me), the number of rules violated, code complexity, and reliance on third party code. You ideally want to see your codebase quality getting better - these graphs give you an instant insight into this.
It's time to pay down your technical debt...
Or at least stop it from growing.
The best way to get a feel for NDepend 5 is to have a play with the 14 day trial version. On a team of any size, NDepend really does show it's value, and will push you and your team into writing better code.