How To: Debug Javascript in Visual Studio 2008
18th Mar 2010
Debugging Javascript in Visual Studio 2008 is very simple.
It does however need a bit of a "kick" to get going. This is how you can do it.
1. Fire up your application in debug mode. Don't bother setting a breakpoint in any of your Javascript source, as it wont work.
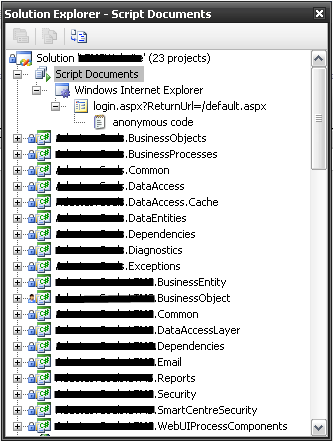
2. Once its running, open Solution Explorer. To do this while debugging, select View and then Solution Explorer. It should look something like this:
Note that this is now showing you what is actually being delivered to the browser. This is important because you might have javascript being added dynamically in your code behind. As you browse around your site you will see the items underneath Windows Internet Exporer (or whichever browser you are using), change.
4. You can then open any of the files underneath your browser node in Solution Explorer by double clicking on them. The files named "anonymous code" will contain the Javascript that is embedded into the page itself. you can then debug this Javascript code by putting a breakpoint in it and waiting for it to be hit.
Very useful and powerful stuff.
